

Strategy Discussion
Tuesday March 10, 2026
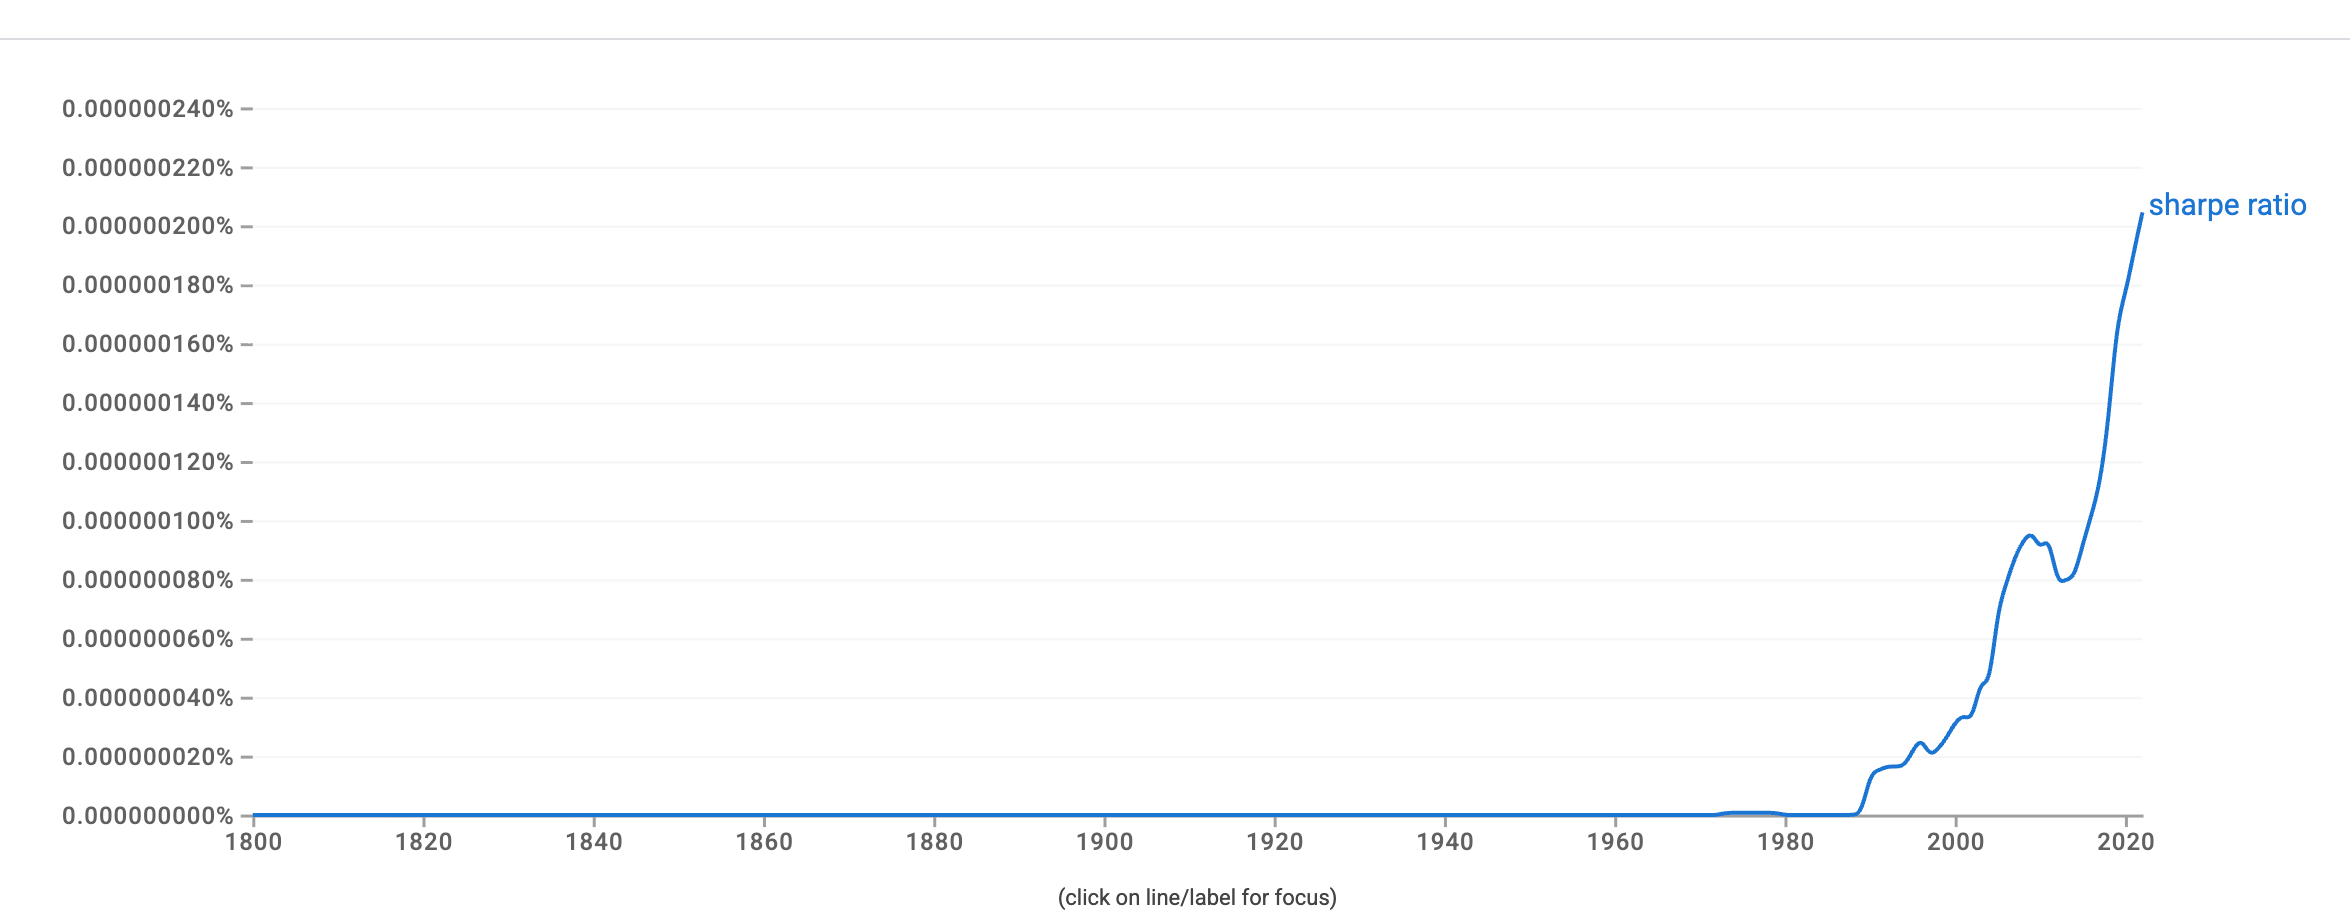
William F. Sharpe in 1966 in his paper “Mutual Fund Performance” introduced the “reward-to-variability ratio” which today is commonly described as the difference between the returns of a given investment strategy and risk-free return.
The Sharpe Ratio emerged from a broader intellectual shift in finance during the 1950s–1970s, when economists began treating investing as a mathematical decision problem. If only they could remove the pesky uncertainty.
Variance (volatility squared) was attractive to Sharpe because:
It was easy to estimate statistically.
It fit cleanly into optimization math.
It allowed determination of closed-form solution.
But, variance in returns is not risk. Not as a rational person would define it. Equating variance to risk is obviously absurd.
So why do we do it? The answer is because Harry Markowitz said we should and for no other reason.
Before Harry Markowitz formalized variance as “risk” in 1952, the concept of risk in investing was much more qualitative and practical, not mathematical. It was based on actual potential for loss rather than statistical measures i.e. risk was risk of loss.
Not wobbliness of returns.
So let’s ignore the last 70 years and go back to 1951 and rethink this problem.
If risk is risk of total loss in an investment how can we quantify that?
Well, we can just examine the data. In recent history, the total number of exchange listed companies is around 6000. In 1996, there approximately 8100 listed companies and today there are around 4200.
Every year there is around 250 IPOs and 350 companies are delisted, withdrawn or deleted, so on average the probability of being delisted is about 5%. The actual data shows the P≈3%−7% per year. So our back-of-the-envelop estimate is right in the middle.
But, we want risk of total loss. Not risk of delisting.
Getting precise probabilities of failure is tricky because delistings happen for several different reasons:
Bankruptcy / liquidation
Mergers & acquisitions
Going private
Failure to meet exchange rules (price < $1, market cap, reporting)
Voluntary delisting or exchange transfer
Only the first category represents true economic failure; the others are structural exits.
If you own a company and it gets delisted because it was acquired for a premium you won’t consider that a bad thing.
2025 was a particularly bad year for bankruptcies but over all the expected probability of an exchange listed company going bankrupt is, P≈0.2%−0.5%.
So that is your risk. If you were to throw a dart and pick a random stock then fall into a coma, the odds you lose all your money on that stock is between 0.2% and 0.5% per year.
Does that seem like a percentage that should stress you out?
An example stock that did do the swan dive is Azul S.A which is the largest airline in Brazil. And yes, the stewardess are very attractive.
On May 28, 2025, Azul filed voluntary petitions for relief under chapter 11 in the United States Bankruptcy Court for the Southern District of New York. At the time of this filing here was the risk chart.
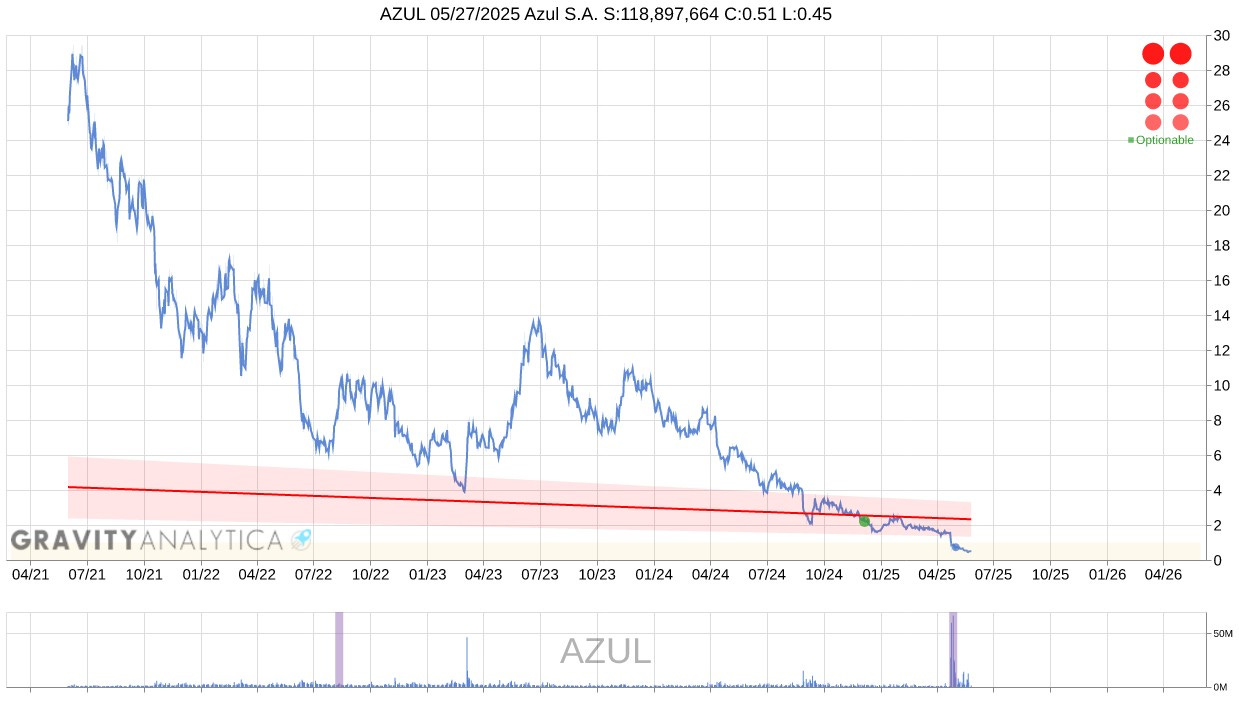
And here is the risk chart for April 2021.
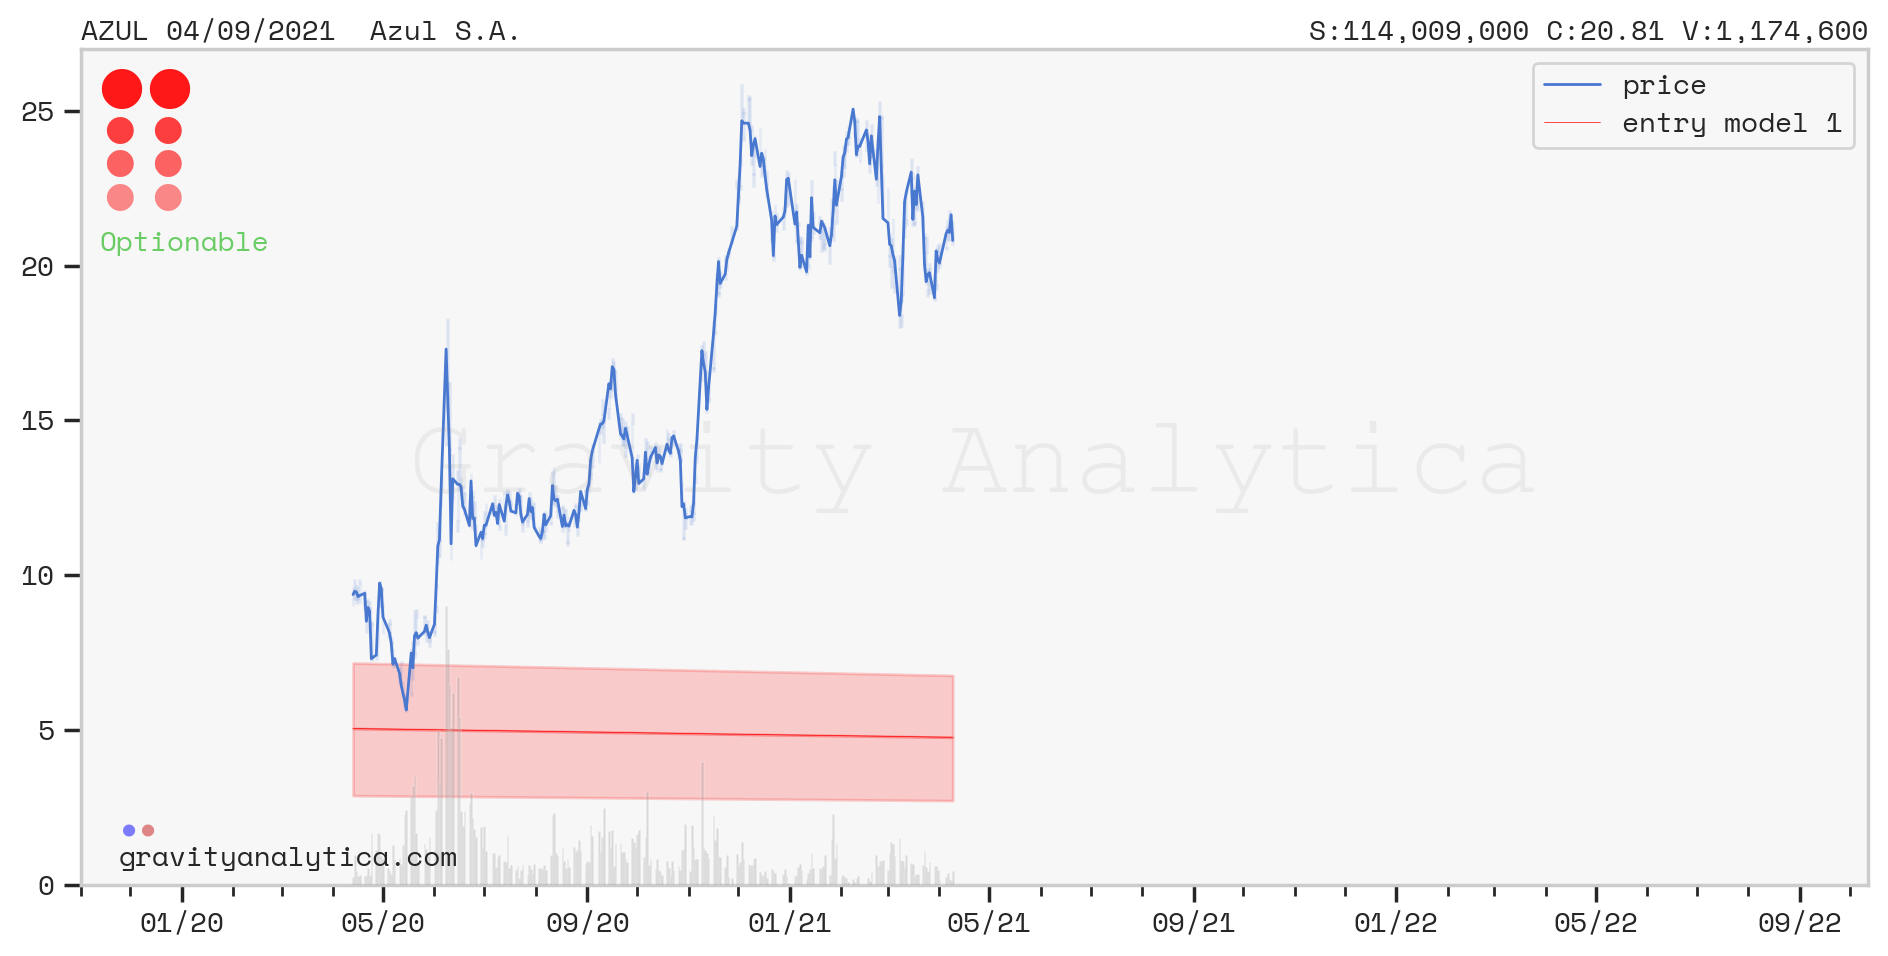
Even if you don’t understand what those dots and that highlighted area are would you buy this? At any point?
The stop-lights reflect the current and previous quarters liabilities with the most recent at the top. The left stop-light is more immediately due liability and the right is liability that can be forestalled.
Our risk charts are just a convenience. You can use Z-scores or just learn to read balance sheets. I am just very lazy and want everything color coded. But, there is really no reason you can’t get that 0.2%-0.5% risk down to near zero.
If true risk can be estimated so easily why is Sharpe Ratio so prevalent? The answer there is because of the rise of index funds. When Vanguard started offering the first index funds in the 1970s, Bogle et all needed a way of comparing two funds. And the Sharpe Ratio is quite good at this. But, it wasn’t until the explosion of hedge funds that it really took off.
Let’s say you have two fund prospectus in front of you. Both return exactly 12% in 2025. How would you chose between the two? A smart person wouldn’t they would just split their investment 50/50 but let’s say for whatever reason you had to.
Sharpe Ratio allows you to do this since it quantifies how volatile the strategies are in comparison. And this gets to the hard of the matter.
Volatility matters because investors are easily spooked. Investors dislike large fluctuations in portfolio value for various reasons not just anxiety. And volatility increases the chance of selling at a loss due to liquidity needs or behavioral reactions, i.e. investors demand to withdraw out of panic. Which freaks fund managers out. This “bank run” is happening right now in private credit and private equity, the supposedly “safe” asset classes.
In practice, Sharpe Ratio matters because the strategies hedge funds deploy under perform various index funds. So in order to get outsized returns hedge funds have to turn up the leverage. Without the potential of outsized returns no one would invest in hedge funds.
A high Sharpe Ratio also means the likelihood of a margin call or being liquidated at a loss is lower than a low Sharpe Ratio. This is actually risk of total loss. But, it is risk of total loss only because the strategies don’t outperform index funds.
But, don’t confuse lower anxiety with lower risk. The fact you are anxious walking in the woods a night does not make it riskier than trying to take a selfie with a moose during the day. Perception, even, if it is based on the understanding that 2 is bigger than 1, is not always reflecting reality.
For example, just recently, investors in California Commercial Mortgage Backed Securities (CMBS) were wiped out entirely.
Bonds which are defined to be the risk-off asset class just went to zero. Right now CMBS is looking very risky as you would define it but it’s still not even in the risk asset class.

When Wall Street says risk, picture a drunk person walking on a sidewalk - they’re wobbly. They may fall down and get bruised but will get up eventually. Most likely they will laugh and be ok.
When Wall Street says “safe” or “risk off” picture a sober person on a high wire. One wrong step and you don’t have time understand why your head just went through your ass.
This manner of Wall Street to portray risk incorrectly is why most people lose money. The golden strategy is one that returns 10% but can be levered up 10x safely. Not the strategy that returns 100% without leverage.
This idea propagates all of finance. People look for 10x returns everywhere and find bankruptcy instead. People think the odds of 2x and 10x are close to the same. Well, they aren’t. But, don’t take my word for it.
Watch this video then let’s do a little math.

If the average stock moves 100%/year (and he is pretty close to correct on this) what is the return on just compounding four 25% returns per year? Just wait and only make four trades per year and you don’t even have to be close to timing the top or the bottom of any single stock just understand the average range.
The return is +144.14%.
Here is CAMP4 Therapeutics (yes, this is a pun about 80s movies and the woods). Where I have marked is where NASDAQ:$CAMP ran the channel. That was a >100% move. If I remember correctly it was a 300% move.
Fluctuations of this size are far more common than you imagine. But, moves of a 1000% in a day are very, very rare.
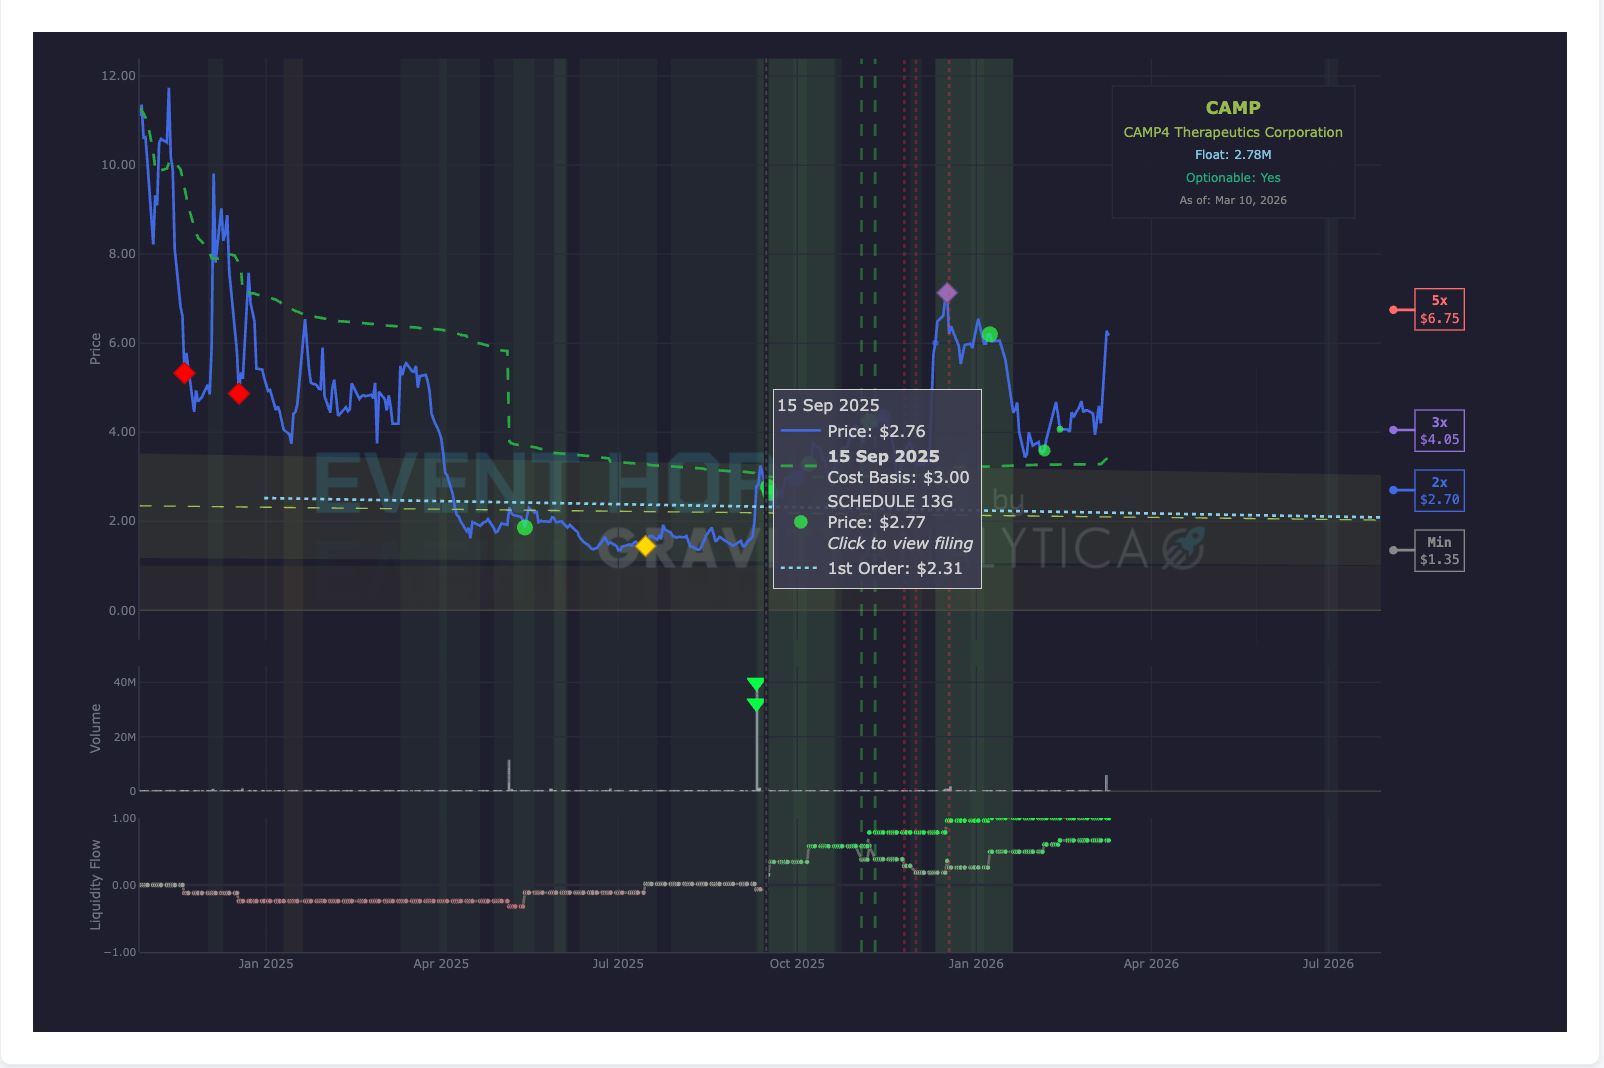
The reason EM0 and EM2 are so wide apart is because they represent that expected move similar to what Lynch was talking about.
We still own CAMP. I just wanted to pick a stock for my pun. And where as there is symbol WOOD it’s a forestry ETF.
As always, if you think there are spelling errors update your dictionary to the latest version. Happy speculation!
— AJ